The Main iPhone Screen
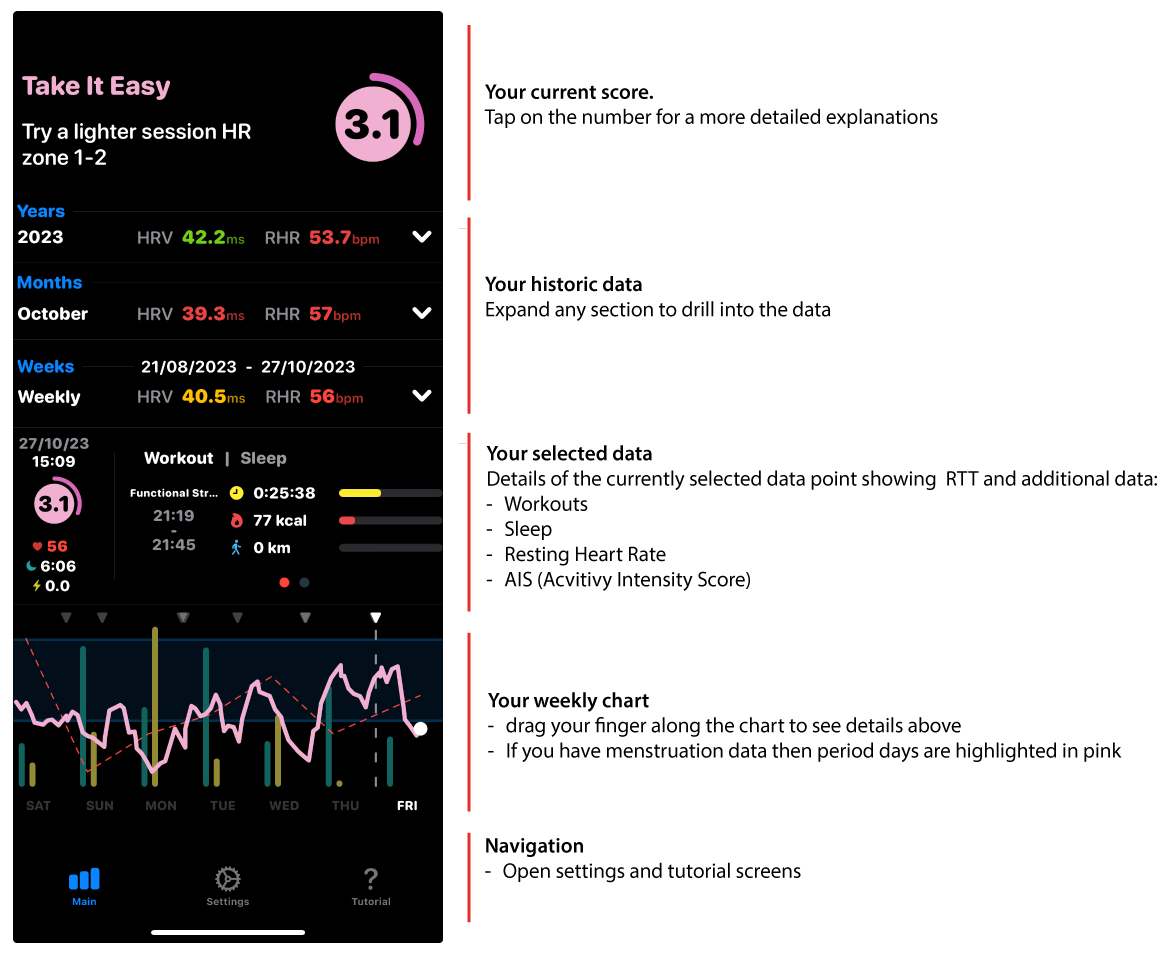
The main iPhone screen shows a wealth of data in the following sections.
Your Current Score
The top of the screen always shows your current RTT score and comment. Tap on the score to see a much more detailed explanation.
Your Historic Data
We use your historical data in Apple Health to create the charts in this section. Expand on any section, then tap on a period of time to see the details of your score in the selected data screen,
Your Selected Data
In this section, we show data for whichever date you have selected. This can include the following (some can be turned on or off in the Settings Screen)
Workout

The workout closest to the selected data point is shown. This will detail the type of workout (e.g. cycling), the time it started and ended, and, in the chart, the duration, active calories and distance. The bars in the chart represent the relative value for this activity compared to the rest of the week.
Sleep

Swipe across from Workut to get the Sleep data. As long as you are logging your sleep in Apple Health using Apple Watch or a third-party app, then the data will show up here. We show the sleep stages (Awake, REM, Core, Deep) and Total sleep in the summary to the left under your RTT score (see below).
The chart lengths represent the amount of this type of sleep stage you have had relative to the rest of the week, making it easy to see how it compares and how it may have impacted your RTT.
RTT and Summary Data

To the left of the Workout/Sleep section, we show the currently selected data point with the following data for that point:
Weekly Chart

The weekly chart shows:
- Your RTT line chart across the week (in pink above because of the score on the selected date)
- The red dotted line is your resting heart rate
- A light blue bar chart showing your sleep duration for each night
- A Yellow bar chart showing your AIS score for that day
- If you have menstruation tracking on, then you may see days highlighted in pink for your period days.
- The white triangles indicate when a workout was logged.
- A blue band in the background which indicates the minimum and maximum bands from your 60-day rolling baseline.
Drag your finger along the chart to change the selected date.